office (011) 764-1954
mobile (078) 801-1125
email: ameyer@interactitsolutions.co.za
BI can handle enormous amounts of unstructured data to help identify, develop and otherwise create new opportunities.
BI, in simple words, makes interpreting voluminous data friendly. Making use of new opportunities and implementing an effective strategy can provide a competitive market advantage and long-term stability.
Generally, Business Intelligence is made up of an increasing number of components.
These include the following: |  |
BI technologies provide historical, current and predictive views of business operations. Common functions of business intelligence technologies are reporting, online analytical processing, analytics, data mining, process mining, complex event processing, business performance management, benchmarking, text mining, predictive analytics and prescriptive analytics.
Though the term business intelligence is sometimes a synonym for competitive intelligence (because they both support decision making), BI uses technologies, processes, and applications to analyze mostly internal, structured data and business processes while competitive intelligence gathers, analyzes and disseminates information with a topical focus on company competitors. If understood broadly, business intelligence can include the subset of competitive intelligence
Business intelligence (BI) is a set of theories, methodologies, architectures, and technologies that transform raw data into meaningful and useful information for business purposes.
When watching F1, have you ever wondered how all that in-car data gets to your TV screen or how teams change strategies and make decisions as the race evolves? If so, then read on...

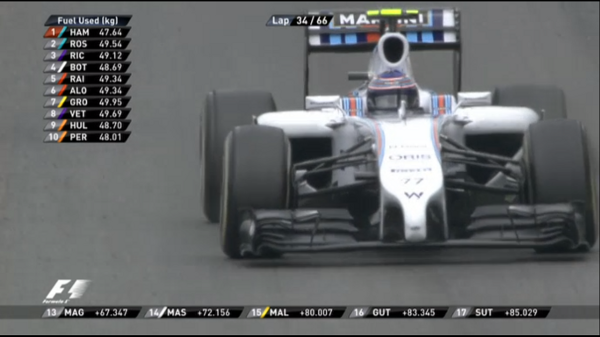
Chasing Hamilton, Rosberg is using more fuel whilst the gap between them is updated constantly
Increasingly most televised sports broadcasts are accompanied by a plethora of statistical data. Whether it's tennis with serve speeds or football with run distance and pass accuracy, timely delivery of such data to viewers is becoming an important aspect of the viewers experience. Consisting of around 80,000 components, the average Formula 1 car contains up to 300 sensors broadcasting telemetry data through the ECU and out over the radio waves. Over the course of one race, this can amount to 1.5 billion data points and even when compressed represents several gigabytes.

That's one hell of a lot of moving data to slice and dice!
If you're an F1 team, how you manage and interpret this data can be the difference between making strategic decisions that will win you the race or blunders that cost you millions in sponsorship. For viewers knowing that your favourite driver is catching the car in front (whose high fuel consumption causes him to slow down to complete the race), only adds to the excitement and understanding.

Will Hamilton exit the pit lane to a clear track or be stuck in traffic causing him to lose precious time?
Formula 1 uses a system called the Advanced Telemetry Linked Acquisition System (ATLAS) developed by McLaren Electronic Systems, to relay information from the car to trackside antennas and then to the teams on the pit wall and the television broadcasters.
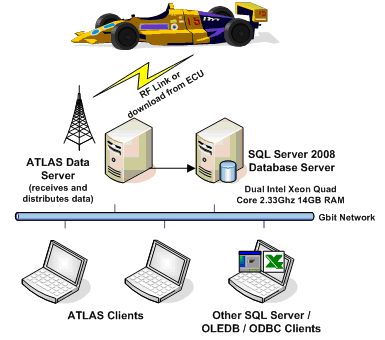
Clients connect to the ethernet backbone and receive information over TCP and UDP. But this is raw unstructured data and receiving it is akin to looking down the mouth of a hose pipe as someone else turns the tap.

So what techniques can be used to extract meaning and derive insight from this flood of information? Indeed, faced with a similar situation, what can you use to help provide value to your customers?
This season, the broadcasters of Formula 1 have begun introducing a new system using Microsoft StreamInsight that filters and derives useful statistics from raw telemetry data. For example, if a typical fuel sensor will only measure the current level every second you can calculate the flow rate or usage if you already know volumes and densities.
Coming under a class of applications known as Complex Event Processing (CEP), StreamInsight is Microsoft's offering for real time data stream processing. Currently in at version 2.3 StreamInsight is the easiest of CEP systems to configure and use.

C# developers already comfortable with concepts such as LINQ and Observables will readily be able to transfer their skills. Additionally, so long as you have a Microsoft SQL Server license, the StreamInsight is free to use and deploy.
As StreamInsight is free, Microsoft has no incentive to sell it, one possible reason why it is known to so few. But by customising an off the shelf CEP system, we can take advantage of data and patterns in that data that would otherwise be ignored.
All CEP Systems share some common concepts all of which should be familiar if you have ever worked with a database before. Here's what you need to know to adapt your thinking from the world of static data querying to filtering moving data.
Any sequence of data whether it is static or moving can be thought of as a stream. Like a FileStream (which is just a sequence of bytes), the speed of a car can be represented as a sequence of numbers that grows as time progresses. Time stamp each data point and you have a time series of complex Events aka an Event Stream.
With languages such as SQL, we can query a database source table and return a subset of that data to ourselves (the sink). For example:
SELECT * FROM Speedometer WHERE lap = 10
Likewise, with an event stream, we can filter a source stream in real time using Linq and pipe the results into a new stream:
var sinkEventStream = from datapoint in speedometerEventStream
where datapoint.lap = 10   select datapoint;
In this example, we've created a sink called sinkEventStream and every time a new event enters into the source (speedometerEventStream), if it's lap property is 10 then it is consequently added to the sink.
A window is essentially a moving view on static data (SQL) or a fixed length view of moving data (CEP). In CEP windows can either be sliding (i.e. they move continuously) or tumbling discrete amounts.
As an example, suppose we have 2 sensors providing us with data to the following SQL tables:
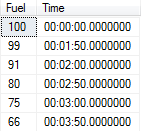
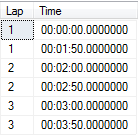
You can join and partition data in with SQL Window functions to keep track of the average fuel for the lap.
SELECT l.Lap , f.Fuel, AVG(f.Fuel )   OVER(PARTITION BY l.Lap  )
AS "Average Fuel This Lap"  FROM   FuelLevel f  Join LapTime l
on  f.Time = l.Time
Similarly with StreamInsight we can join streams, group them and then partition them over time or by arbitrary values:
CepStream<Fuel> FuelLevel;  CepStream<Lap> LapTime;
var joined = from f in FuelLevel
join l in LapTime
on f.Time equals l.Time
select new LapAndFuel() { FuelLevel = f.FuelLevel, Lap = l.Lap};
var AverageFuelStream = from win in
joined
group win by win.Lap into eachGroup
from window in eachGroup.SnapShotWindow()
select  new {Average = window.Avg(), Lap = window.Lap};
So essentially, StreamInsight gives us much the same functionality as you would expect from SQL Server with the added advantage that everything is happening in real time. Mix this in with the ability to easily call out to other sub systems and you have the beginnings of a system that can monitor data and make intelligent decisions.

Leadership enabled by speed AND intelligence?
Windows 8 is the technological equivalent of marmite. Whilst the system is not as universally hated as Windows Vista, the latest Microsoft operating system certainly polarises opinion. Critics say the modern UI lacks important functionality, the experience of switching between the desktop and the modern apps is jarring, and the lack of genuine start button is confusing.
On the other hand, its supporters say that the faster start-up, excellent OneDrive (formerly SkyDrive) integration, and the ever-growing app store more than make up for its deficiencies elsewhere.
One factor is frequently overlooked though – Windows 8 is unquestionably Microsoft’s most secure version of Windows to date. After being regularly criticised for poor levels of security in past operating systems, Microsoft deserves credit for the wholesale changes made to their latest release.
MakeUseOf investigates the features that make Windows 8 the most secure Windows version yet…
Secure Boot is a security standard developed by members of the PC industry to help make sure that your PC only boots an operating system that is trusted by your PC manufacturer. You will find it on all new logo-certified Windows machines.

PCs which have Secure Boot use UEFI firmware instead of the traditional BIOS. By default, the machine’s UEFI firmware will only boot software signed by a key embedded in the UEFI firmware. If the software is not trusted, the PC will initiate an OEM-specific recovery sequence to restore the original trusted software.
On older, non-Windows 8 PCs, a rootkit can install itself and become the boot loader. An infected computer’s BIOS would load the rootkit at boot time, which would then help intruders gain access to systems while avoiding detection. Secure Boot prevents this from happening.
 +
+
Microsoft SharePoint is a popular option for businesses looking to better manage and analyze its data.
A good fit for organizations that currently use Microsoft Dynamics products and store information using Microsoft SQL Server. SiSense is a BI tool that was developed for all types of user--even those with little or no prior experience with BI software. SiSense's tools manage and support business data with powerful visuals and tools.
×+
SiSense is a BI tool that was developed for all types of user-
-even those with little or no prior experience with BI software. SiSense's tools manage and support business data with powerful visuals and tools.
× +
+
Breakthrough performance and faster insights delivered by a hybrid data platform
SQL Server 2014 enables customers to build mission-critical applications and Big Data solutions using high-performance, in-memory technology across OLTP, data warehousing, business intelligence and analytics workloads without having to buy expensive add-ons or high-end appliances. SQL Server 2014 uses a common set of tools to deploy and manage databases both on-premises and in the cloud, which makes it easier for customers to take advantage of the cloud with existing skills.
×Lorem ipsum dolor sit amet, consectetuer adipiscing elit.
Lorem ipsum dolor sit amet, consectetuer adipiscing elit, sed diam nonummy nibh euismod tincidunt ut laoreet dolore magna aliquam erat volutpat. Ex ea commodo consequat. Duis autem vel eum iriure dolor in hendrerit in vulputate velit esse molestie consequat.
×
 +
+
BI Solutions distinguishes itself from others by focusing on a specialized segment of software integration and development. With almost a decade of delivering Business Intelligence (BI) solutions to our customers, we excel at the design and implementation of business intelligence and data warehouse applications. Our attention to these core competencies makes us a compelling option for your next project.
Whether you are looking for specialized staff augmentation or you need to engineer an end-to-end enterprise wide reporting solution, we have the personnel and experience, expertise and commitment to make your next project a success on-time and within budget.
× +
+
We understand that many consultancies’ promises just don't match their final deliverables. In response to this unfortunate reality, we have instituted a "Prove it" initiative.
After an initial on-site visit we will assess your needs, return to our corporate offices and tailor a demonstration proposal intended to prove our capabilities. If this proposal is agreeable to you, for a nominal fee we will utilize our own personnel, hardware and software environment to develop a proof of concept (POC).The intent of the POC is to share with you our vision of what is possible in your environment, using sample customer data when possible. Our goal is to provide a comfort level with our capabilities and we believe that the best way to do that is to actually show you what we can do. If the vision we formulate is compelling enough, we can negotiate a longer term commitment to your firm. If it isn't, we are happy to share our source code with you and part ways amicably. In a world full of false promises, we want will to earn your trust. We will "Prove it".
× +
+
In a world exploding with data, one of the most efficient ways to gain a competitive advantage and make effective decisions is to simply use the data you already collect.
You can't do that without a comprehensive reporting solution. Many of our clients have a cadre of staff that can complete ninety percent of their firm's reports but can really benefit from our assistance for a small number of very complex reports. Others have tried building out reporting systems using tools that aren't appropriate for the enterprise and need to convert to a more comprehensive solution. Occasionally we even find customers that wish to outsource all reporting to us. Whatever the case, we have the staff and expertise to offer any level of support you may require.
× +
+
BI Solutions provides end to end reporting solutions for clients both large and small.
We have the ability to work within a range of database environments, from multi-terabyte MS SQL Server or Teradata warehouses to client based MS Access databases. We can use a customer’s existing reporting tools or we can start from the ground up and implement a customised BI solution.
×BI Solutions distinguishes itself from others by focusing on a specialized segment of software integration and development
Site by